Platform-Reported ROAS Is Lying to You
Add up every platform's self-reported ROAS and you've "made" more sales than your bank ever saw. Here's the Three Layers of Marketing Truth — platform, blended, incremental — and how to find the number that's actually real.
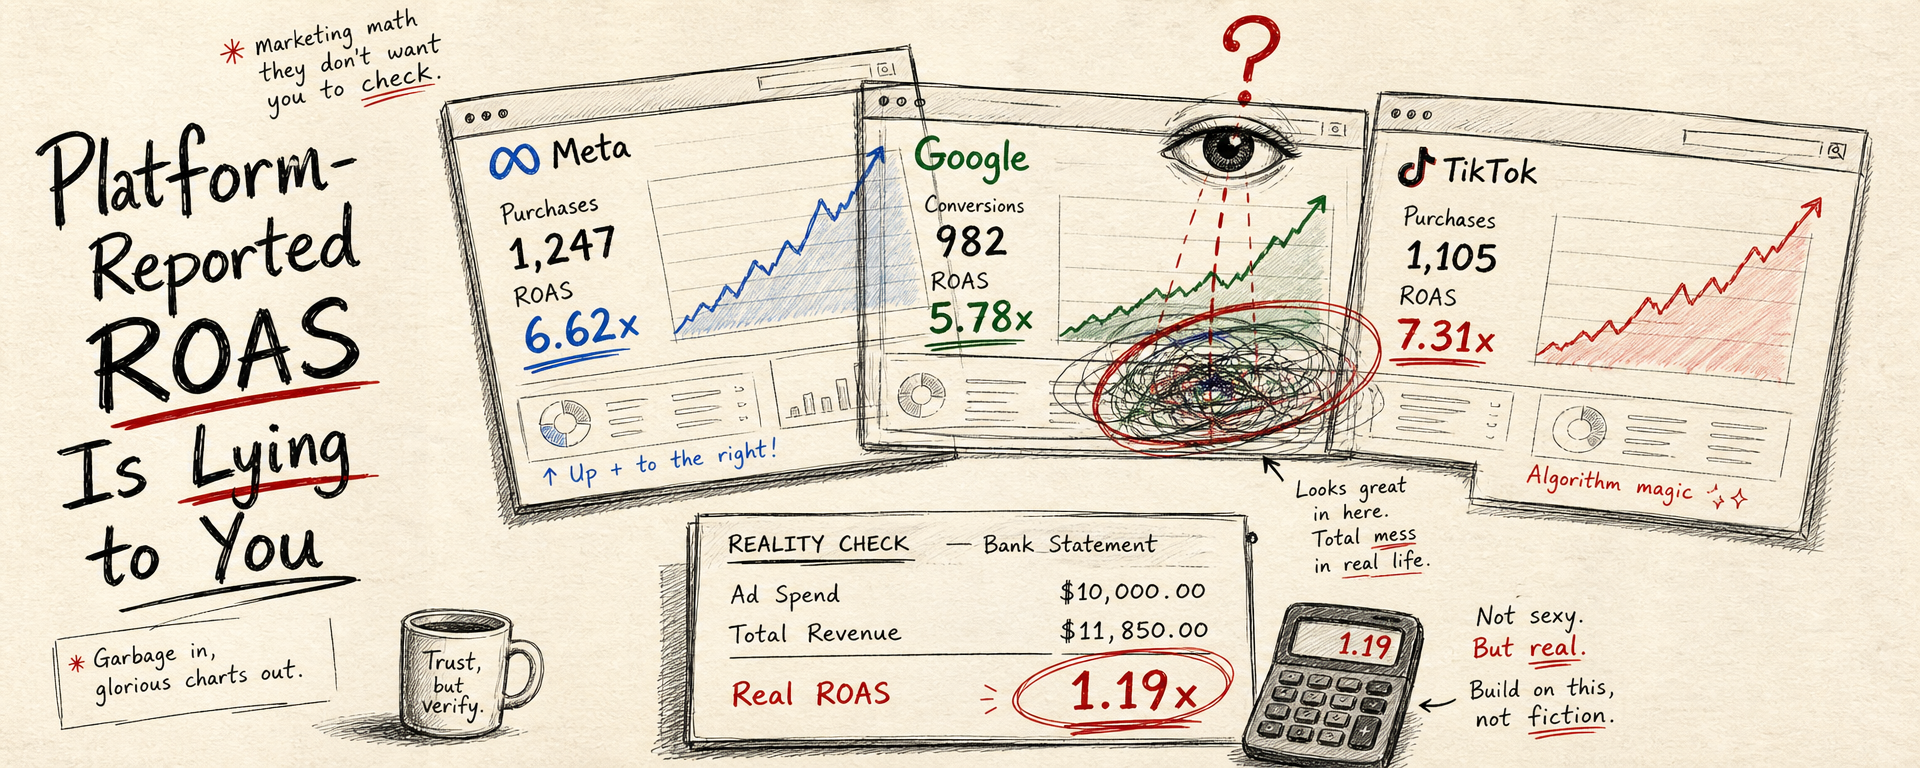
Picture your week-end dashboards.
Meta says you made 60 sales. Google says 41. TikTok says 49.
Congratulations — you made 150 sales. From 98 real orders.
TL;DR: Every platform reports its own ROAS, and every platform grades its own homework — so the numbers add up to more sales than your bank ever saw. Independent measurement firms find platforms over-attribute by roughly 20–60%; a "3x" campaign often delivers ~1.5x incrementally.12 The fix isn't a better attribution model — it's knowing which of the Three Layers of Marketing Truth you're looking at: platform truth (inflated), blended truth (MER), and incremental truth (the only one that's real). Here's how to tell them apart. (We promised to unpack this in our allocation piece — here it is.)
The number that doesn't add up
It's Friday. Your Shopify dashboard shows 98 orders this week.
Then you open the ad platforms. Meta claims 60. Google claims 41. TikTok claims 49. That's 150 "conversions" from 98 actual customers.3
The platforms aren't glitching. When one shopper sees your ad on all three before buying, all three legitimately record the sale inside their own systems. Each is telling its own truth. Summed together, those truths describe a business that doesn't exist.
Why the gap is bigger than you think
This isn't rounding error. Independent measurement firms find platforms over-attribute by roughly 20–60% — a campaign showing 3x on-platform often delivers closer to 1.5x incrementally, and public case studies put the reported-vs-measured gap at 1.5x–3x.12
The worst offender is usually the best-looking number. A branded-search campaign might report 8x ROAS — strip out the shoppers already typing your name, and true incremental ROAS can fall to ~2x.1 One analysis put Performance Max's self-reported impact about 33% too high.1 The prettier the dashboard number, the more organic demand it's quietly absorbing.
The three reasons your ROAS is inflated
1. Everyone grades their own homework. Each platform scores its own effectiveness, so it has a built-in incentive to claim credit generously. No platform will ever hand you a report that says "actually, we didn't do much this month." (Same reason no platform will allocate your budget for you.)
2. Attribution windows eat organic demand. Default last-click plus multi-day view-through windows let a platform take credit for demand it didn't create — the branded searcher, the returning customer, the person who'd have bought anyway.1
3. Half your conversions are modeled. With Apple's ATT opt-in around 25% globally, a large share of iOS conversions are estimated, not observed — and the model filling the gap is tuned by the party that benefits when the number looks good.1
Notice the slope: the first one everyone understands, the second every media buyer knows, the third is the technical detail underneath. They stack.
The Three Layers of Marketing Truth
Here's the mental model to keep. Every marketing number lives on one of three layers — and they answer completely different questions:
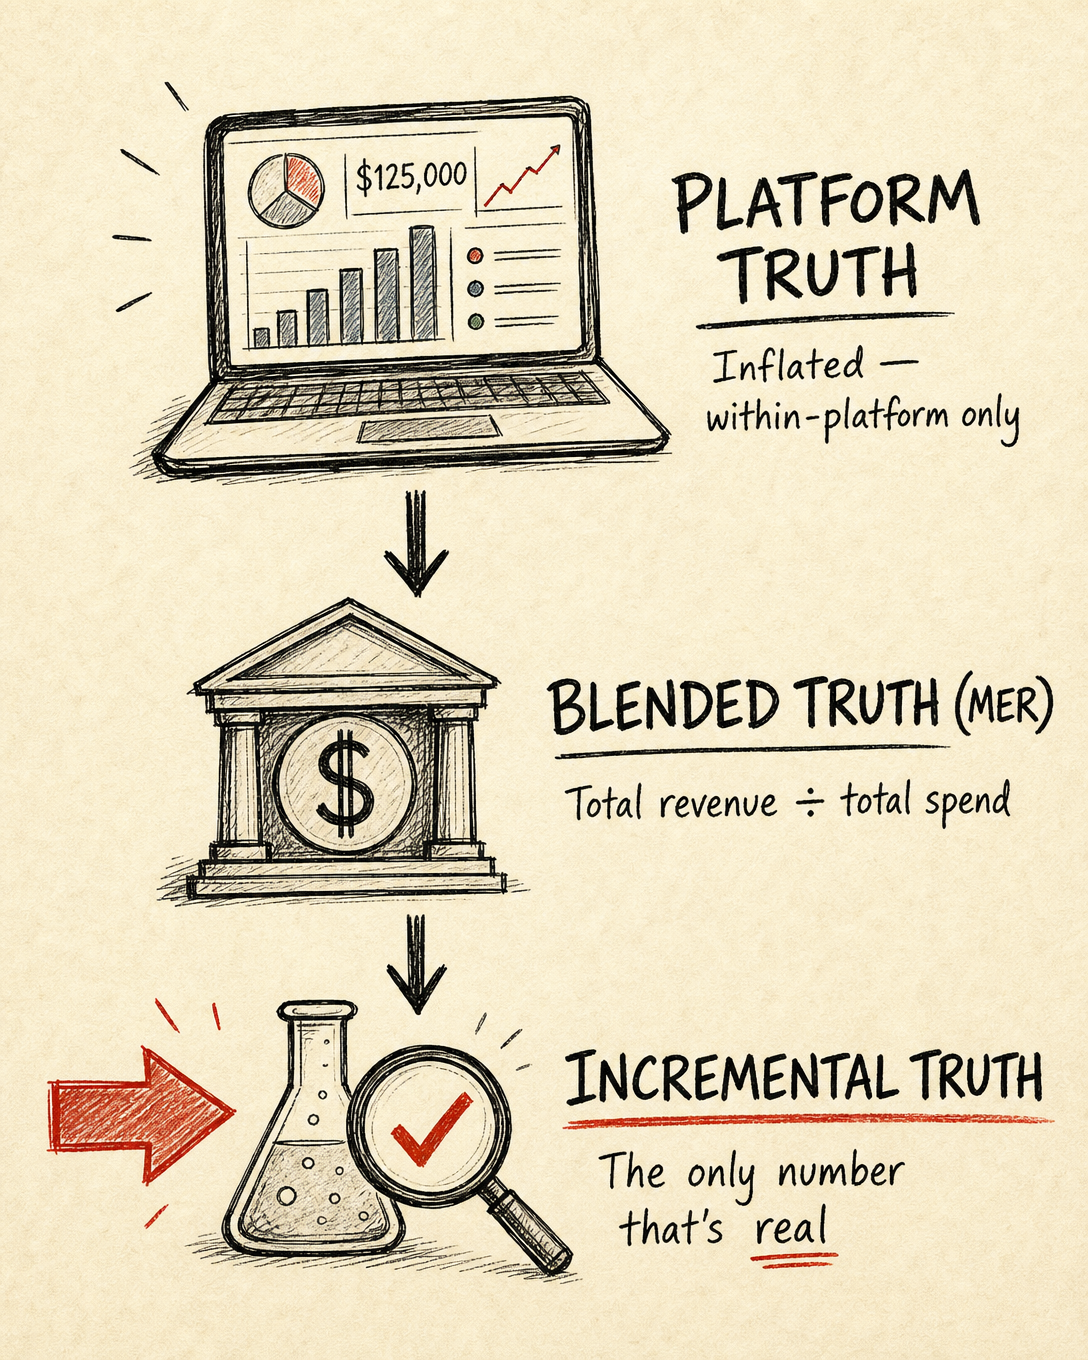
Layer 1 — Platform Truth (dashboards): "How much credit does each platform claim?" → Inflated. Fine for within-platform direction only.
Layer 2 — Blended Truth (MER): "Did the business actually make money?" → Total revenue ÷ total spend. Platforms can't inflate it.
Layer 3 — Incremental Truth (geo / holdout tests): "What did the spend actually cause?" → The only number that's truly real.
Most teams optimize on Layer 1 and wonder why the P&L doesn't match. The discipline is simple: use platform dashboards for steering inside a platform, MER as the reality check, and incrementality for the truth.
MER vs platform ROAS
If you take one habit from this piece, make it this:
- Platform ROAS answers: "How much credit does this platform think it deserves?"
- MER (total revenue ÷ total spend) answers: "Did the business make money?"
Only one of those shows up in your bank account.
And the truth layer: incrementality
The only way to know what your spend caused is an experiment. Geo-split holdouts are the 2026 gold standard — turn a channel down in some regions, hold others steady, and measure the real delta in total sales. It's unaffected by cookies or iOS limits, and no platform's self-report can fake it.2
Where an agent helps — and where it doesn't
Any automation layer that acts on ad accounts should start from one assumption: platform-reported ROAS is wrong. Optimize on top of it and you're just scaling attribution bias faster.
That's why GrowthGPT treats platform ROAS as one signal, not the truth — it cross-checks performance across Meta, Google, and TikTok in one place, flags when platform ROAS diverges from your blended MER by more than your tolerance threshold, and benchmarks against your own history rather than a platform's self-graded score. It doesn't replace an incrementality test; nothing does. It just stops you from steering by a scoreboard each platform wrote about itself.
The bottom line
If every channel reports it's winning, someone's math is wrong — and it's yours, because you're the one adding it up.
ROAS isn't broken. The scoreboard is.4
FAQ
Why does my summed platform ROAS exceed my actual sales? Each platform counts the same multi-touch conversion inside its own system, so the totals overlap — e.g., platforms reporting 150 conversions against 98 real orders.3
What is MER in marketing? MER stands for Marketing Efficiency Ratio: total revenue ÷ total marketing spend. Unlike platform ROAS, it's computed from your own financial data, so no single platform can inflate it. It's the simplest "did the business make money?" metric.
What's the difference between MER and platform ROAS? MER (total revenue ÷ total spend) tells you if the business made money; platform ROAS tells you how much credit that platform claims. MER is the one your bank agrees with.
What's the difference between reported ROAS and incremental ROAS (iROAS)? Reported ROAS is what the platform claims; iROAS is the lift that wouldn't have happened without the spend. Public case studies show reported ROAS overstating iROAS by 1.5x–3x.2
How do I measure true ROAS? Incrementality testing — geo-split holdouts especially — plus a blended MER view. Use platform dashboards only for within-platform direction, never as the cross-platform scoreboard.
Can automation or an AI agent fix inflated ROAS? Not on its own — if it optimizes on platform-reported numbers, it inherits the inflation. What helps is a layer that treats platform ROAS as one signal, cross-checks sources, flags divergence from blended MER, and benchmarks against your own history — paired with real incrementality testing.
See how your MER compares across channels.
Footnotes
-
"Why Your Paid Social ROAS Is Wrong (And How to Fix It in 2026)" — over-attribution 20–60%, branded-search and PMax examples: https://aibrify.com/blog/paid-social-roas-reality-2026 ↩ ↩2 ↩3 ↩4 ↩5 ↩6
-
Haus — Google Ads incrementality testing & reported-vs-measured iROAS case studies (Bombas, True Classic, Liquid Death): https://www.haus.io/article/google-ads-incrementality-testing ↩ ↩2 ↩3 ↩4
-
Ruler Analytics — how double-counting conversions across platforms skews budget allocation: https://www.ruleranalytics.com/blog/reporting/conversion-duplication/ ↩ ↩2
-
Measured — "Your ROAS Is Lying to You": https://www.measured.com/faq/misleading-roas/ ↩